Contact Sales

Edsby Student Analytics

Edsby Student Analytics: achievement insight you can act on, in near real time.

Most K‑12 systems report on activity. Edsby reports on achievement, using near real-time data and Power BI dashboards built directly into the platform your teachers already use.

A gray-haired administrator in glasses works at a laptop in a modern office

Most K‑12 data lives in the rear-view mirror

  1. Stale, batch-imported data

    Conventional data warehouses import academic data periodically, so by definition it is historical.

  2. IT-gated reporting

    Insight waits in a queue instead of reaching the people who can act on it.

  3. Activity, not achievement

    Many systems show how often students log in, not how well they are learning.

  4. Disconnected data sources

    Achievement, attendance and outside assessment results sit in different places.

The Edsby difference

Unlike standalone BI tools, Edsby Student Analytics is already wired into your data.

It gives districts and regions a single, permission-aware view of achievement data, built on the platform teachers, students and parents already use every day.

A standalone BI tool

  • A separate rollout, with a second system to train staff on
  • Manual export and import to maintain
  • Security added afterwards as a separate layer

Edsby Student Analytics

  • No separate rollout: it runs on the same Edsby teachers, students and parents already use every day
  • No duplicate data entry: student records, class rosters and achievement data are already in Edsby
  • Built-in governance: role-based access and data governance are part of the platform

Most platforms show you activity. Edsby shows you achievement.

Find trends, not just totals

See who needs help while there is still time

Breakthrough learning analytics capabilities enable educators to find trends in achievement data and identify at-risk students in near real time, across an individual school, a group of schools, or a whole district or region.

  • Trends and at-risk students in near real time, not weeks later
  • Filters by average, homeroom teacher and more
  • System analytics as well as learning analytics
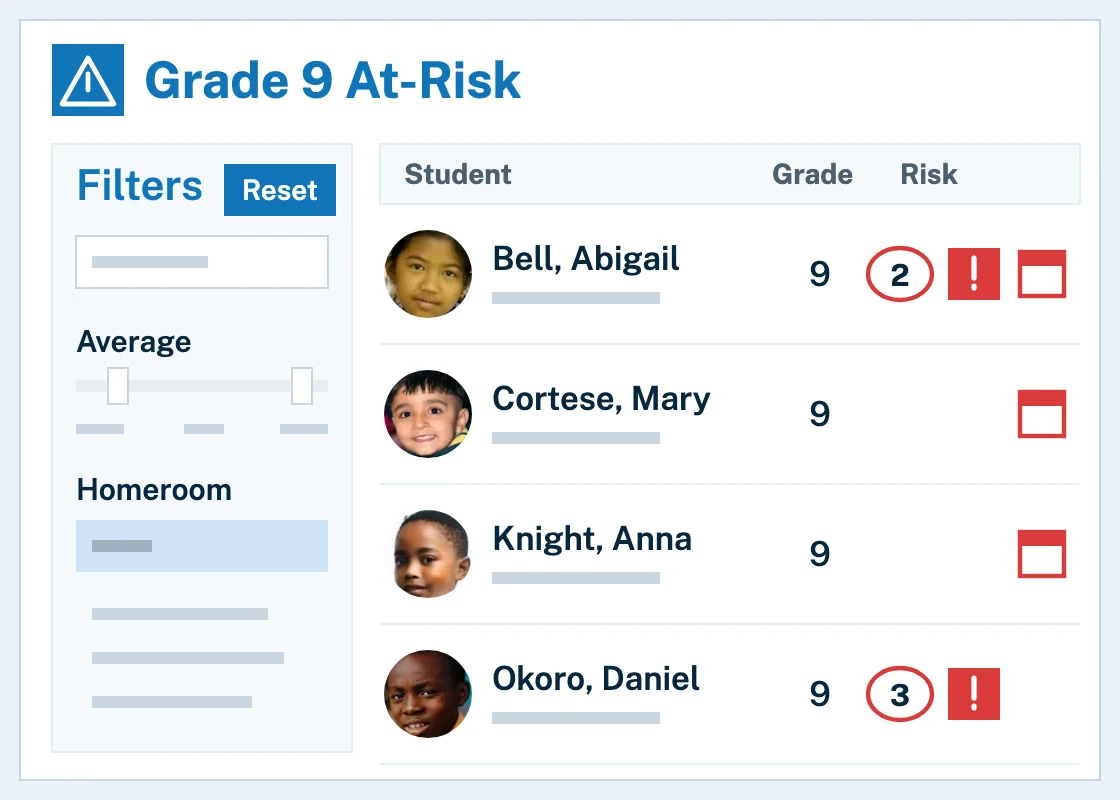
The Edsby Student Analytics Grade 9 At-Risk list: filters at the left, and four students each with a photo, name, grade and risk indicators such as a circled count, an alert and a calendar mark

Real-time, not rear-view

Today’s attendance, not last term’s

Conventional data warehouse approaches require academic data to be imported periodically. Edsby offers near real-time insight using data current to the day before.

  • Ready-made Power BI dashboards
  • Attendance, achievement and report card data in one place
  • Filtering and drill-down built in
Edsby Student Analytics attendance overview: three figures for attendance records, students and absence rate above a Student Risk chart with a column for each month, mostly green for students above 90 percent with small orange and red marks

Drill down by role and geography

Find what is driving the change

Powerful drill-down capabilities let users find exactly what they’re looking for, from a single class to an entire district or region, including which factors influence a result such as student late rates.

  • From one class to a whole district or region
  • See which factors influence a result
  • Key influencers ranked by their effect
Edsby Student Analytics Areas of Opportunity: the question What drives change in student Late Rates, a list of key influencers each marked by a circle showing its effect, and a bar chart of the late rate for three school years against the average

Achievement and learning skills

Curriculum expectations and work habits, year over year

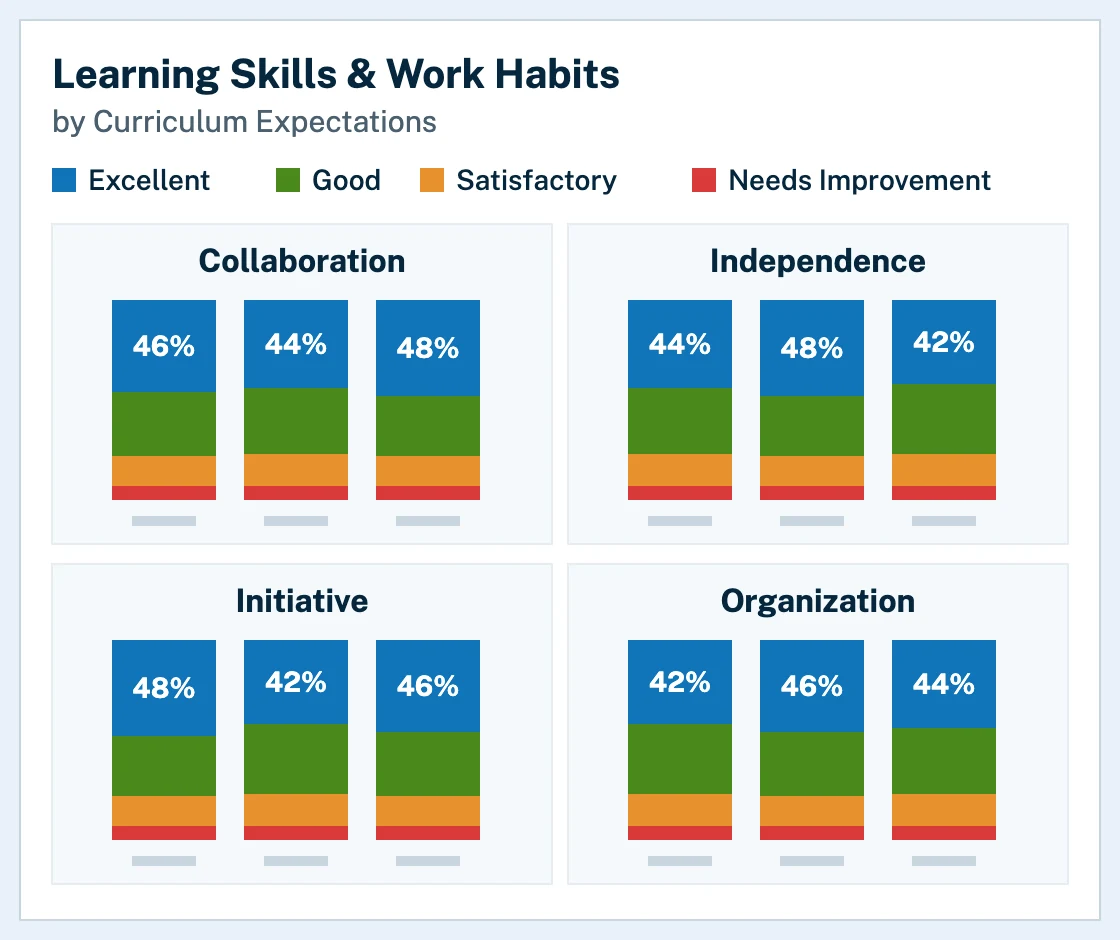
Dynamic, living views of achievement give educators and policymakers more than attendance and grades: they can follow learning skills and work habits against curriculum expectations across school years.

  • Learning skills and work habits by school year
  • Excellent, Good, Satisfactory and Needs Improvement levels
  • Three school years side by side
Edsby Student Analytics learning skills and work habits: four small stacked column charts for Collaboration, Independence, Initiative and Organization, each with three school years split into Excellent, Good, Satisfactory and Needs Improvement

Any source, one picture

Bring in data from outside Edsby

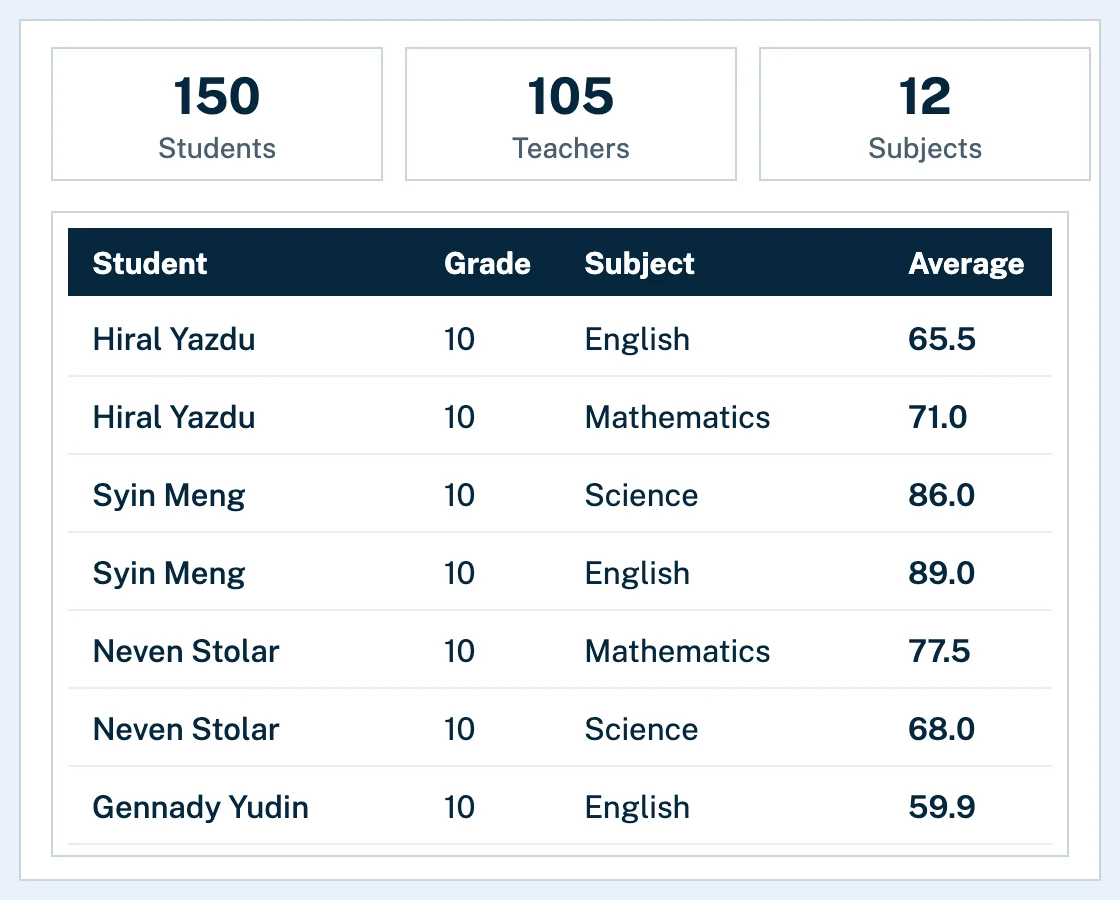
The learning record store behind Edsby’s analytics can include data from Edsby and other LMSes, gradebooks, or sources such as EQAO, PM Benchmarks, standardized tests and CASI, even from SQL tables or CSV files.

  • Enrolment, student and course detail in one view
  • An optional service can push analytics data nightly to your own Azure SQL database
  • Data current to the day before
Edsby Student Analytics enrolment student details: figures for students, teachers and subjects above a table of students with grade, subject and average

Permission-aware by design

The same permissions your district already trusts, applied to analytics

Edsby uses its permissions system, synchronized automatically with your existing district or region databases.

  • Teachers see their own students

    Teachers see information only on the students they currently teach, with no separate access request required.

  • Principals see their own school

    Principals and office staff see information relevant to their own school.

  • Districts and regions see it all

    District and regional officials can access information across the whole district or region.

Recognition

Award-winning learning analytics

Edsby has been honoured for its learning analytics and data capabilities, including the 2025 EdTech Awards and an earlier SIIA CODiE Award.

View all awards

FAQ

Questions about Edsby Student Analytics

Answers for district leaders, analysts and principals.

What is Edsby Student Analytics?

Edsby Student Analytics is a licensed option that adds near real-time, permission-aware achievement analytics on top of the core Edsby platform. It uses Microsoft Power BI to give educators and policymakers dynamic, living dashboards, with filtering and drill-down, at the school, district, or regional level. Unlike conventional data warehouses that require periodic imports, Edsby Student Analytics offers insight using data current to the day before, and it runs on the same permissions system your district already trusts.

How is this different from the analytics already built into Edsby?

Edsby includes classroom-level tools like Perspective Analyze, which lets a teacher pivot their own gradebook and evidence data, and the Panorama, which gives a single view of one student. Edsby Student Analytics operates at a different scale: school, district, or regional dashboards built for administrators and policymakers, not just individual teachers looking at their own classes.

How current is the data?

Academic data must be imported periodically in conventional data warehouse approaches, so by definition it’s historical. Edsby Student Analytics offers near real-time insight using data current to the day before.

Who can see what?

Edsby Student Analytics uses the Edsby permissions system, synchronized with your district or region databases. Teachers see information only on students they currently teach. Principals and office staff see information relevant to their own school. District and regional officials can access information across the whole district or region.

Can we bring in data from outside Edsby?

Yes. The learning record store behind Edsby Student Analytics can include data from Edsby and other LMSes, gradebooks, or sources such as EQAO, PM Benchmarks, standardized tests and CASI, even from SQL tables or CSV files. An optional service can also push analytics data nightly to your own Azure SQL database.

Is there a charge for Edsby Student Analytics?

Yes. Edsby Student Analytics is a licensed option. Contact Edsby for pricing details.

A man inviting you to contact Edsby

Let’s talk about Edsby Student Analytics

Talk with our team about your district, region or school.